First investigation
From login attempt to actionable evidence
This walkthrough shows where to open the extension, how to capture one clean authentication attempt, what to inspect in each workspace, and how to export the result for further troubleshooting.
Before you begin
Install from the Chrome Web Store, or follow the offline installation guide. Use a test account when possible and handle captured cookies, tokens, SAML messages, and certificates as sensitive data.
1. Open the panel
- Navigate to the application page whose authentication flow you want to inspect. The tab must display a normal
http://orhttps://page before you open DevTools. - Open Chrome DevTools with View > Developer > Developer Tools, the page's Inspect command, or the operating-system keyboard shortcut.
- Select Auth Flow Inspector in the DevTools tab strip.
- If it is not visible, open the DevTools double-chevron overflow menu and select it there.
- Keep DevTools attached to the application tab throughout the login attempt. Undocking DevTools can provide more space without changing capture behavior.
chrome://newtab page. Chrome does not
allow DevTools extensions to register panels on New Tab, chrome://extensions, Chrome Web
Store pages, or other restricted browser pages. Navigate to an ordinary website first, then open
DevTools. If DevTools was already open when the extension was installed or reloaded, close and reopen
DevTools after navigating.
The extension inspects only the tab to which DevTools is attached. Authentication steps that open a separate browser tab are outside that panel's capture unless DevTools is also opened for the new tab.
2. Capture a clean login attempt
- Select Traffic Inspector.
- Select Clear to remove requests from an earlier investigation.
- Select Start capture if capture is paused.
- Reload the protected application page or begin the sign-in action.
- Complete the login, reproduce the failure, or stop at the exact stage you are investigating.
- Select Stop capture so incoming application traffic no longer changes the evidence.
3. Read the request timeline
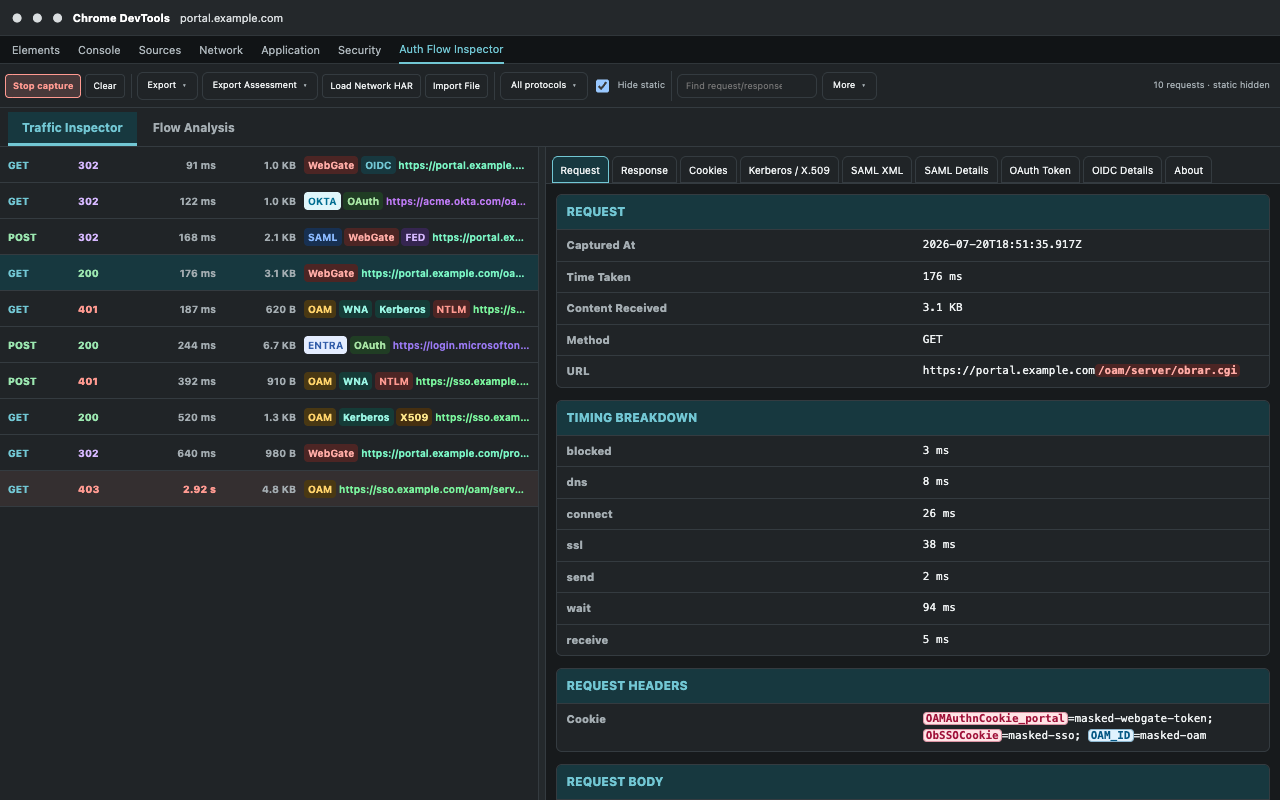
Begin at the first protected-resource request and read downward in browser sequence.
| Column or marker | What to look for |
|---|---|
| Method | GET commonly follows redirects; POST may carry credentials, SAML responses, or token requests. |
| HTTP status | 200/204 success, 3xx redirect, 401/403 authentication or authorization evidence, and 5xx server failure. |
| Duration | Longer and highlighted requests may identify a slow identity provider, OAM server, callback, or application return. |
| Size | A zero-byte redirect can be normal; a response body may contain an error, SAML form, or token payload. |
| Tags | Use OAM, WebGate, SAML, FED, OAuth, OIDC, Kerberos, NTLM, X.509, Okta, and Entra tags to locate protocol evidence. |
| URL color | The same host and port retain the same readable URL color, helping you follow browser transitions between application, gateway, and identity-provider hosts. |
Use Protocols to narrow the list, Hide static to remove scripts, fonts, and images, and Search to find a URL, header, cookie, request ID, ECID, issuer, or response text. Reset filters before concluding that a request was not captured.
4. Inspect the selected request
Select a request on the left, then review the right-side tabs in this order:
- Request: confirm the complete URL, query parameters, request headers, form data, body, timing, and method.
- Response: check the status,
Locationredirect,WWW-Authenticatechallenge, response headers, body, and timing. - Cookies: compare cookies sent by the browser with cookies returned by the server. OAM and WebGate cookie names use distinct highlights.
- Protocol details: open Kerberos/X.509, SAML, OAuth Token, or OIDC Details when the corresponding evidence exists.
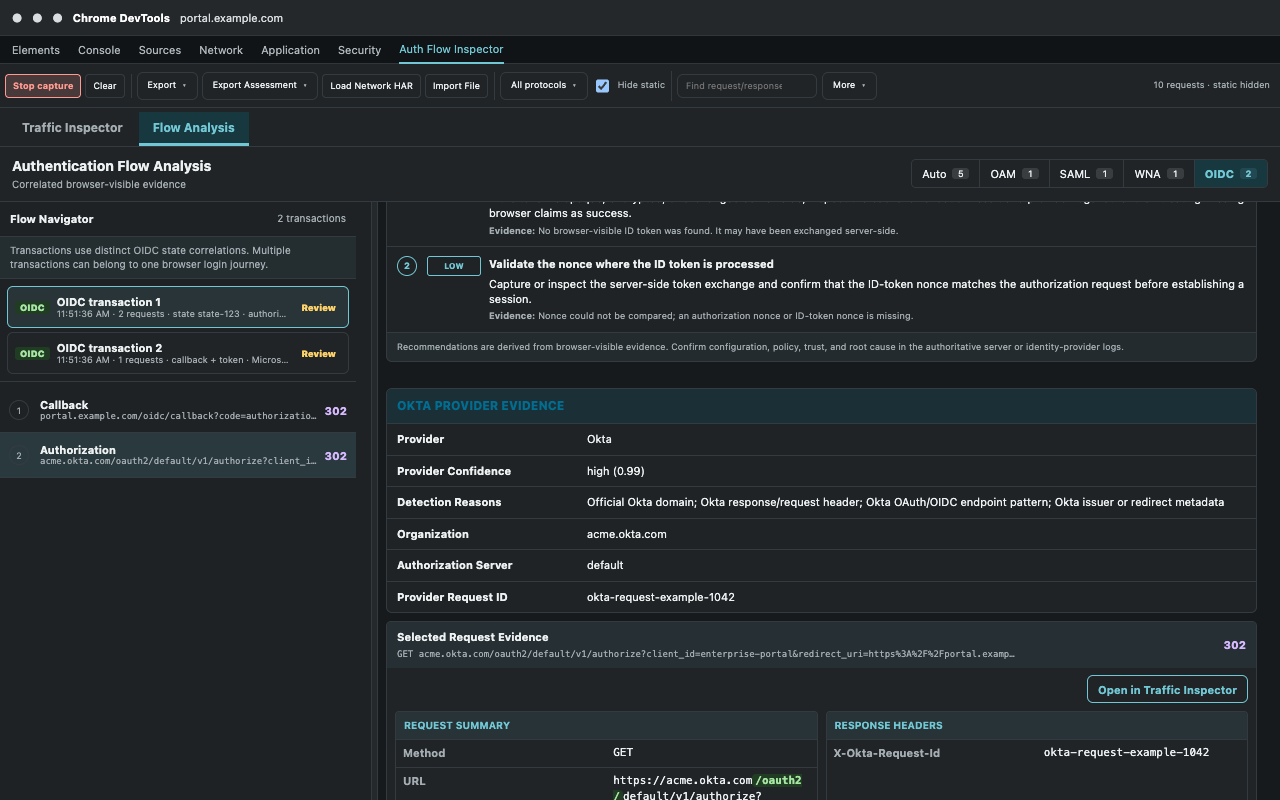
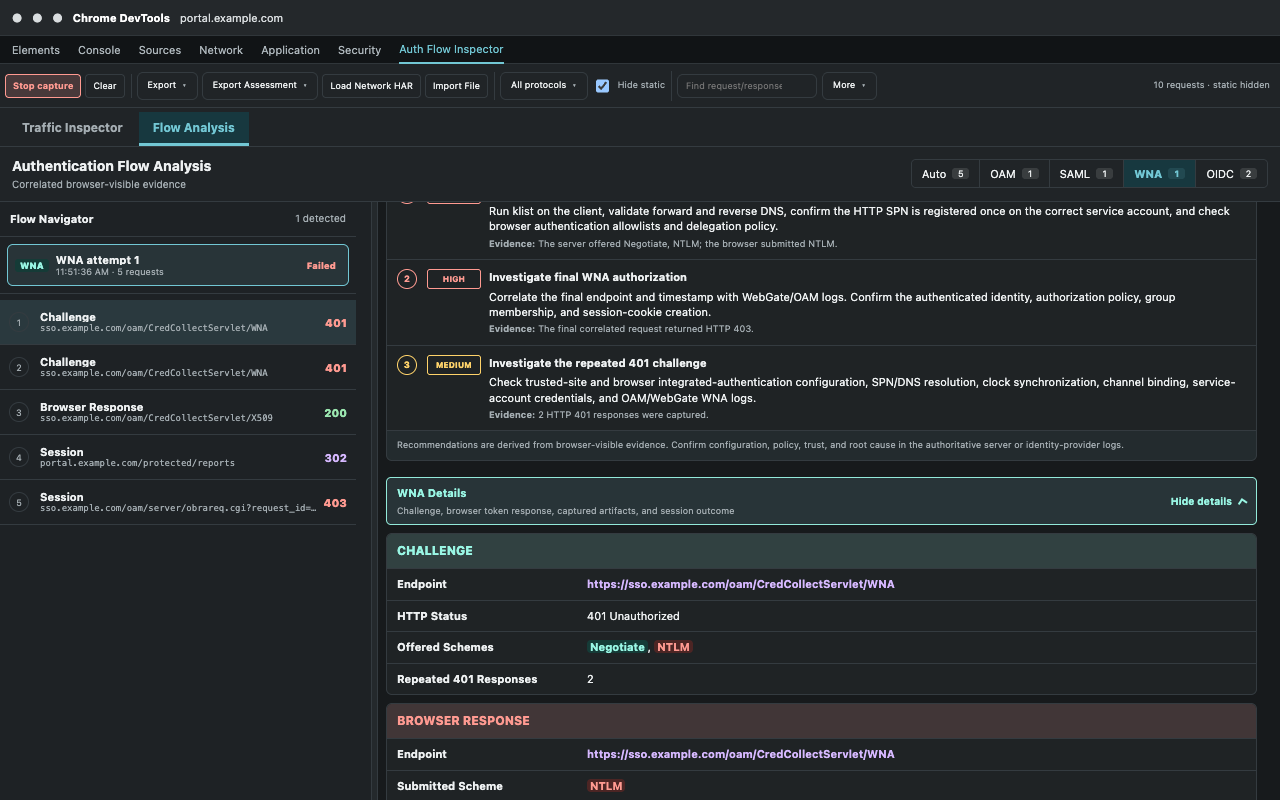
5. Analyze the complete authentication flow
- Select the primary Flow Analysis workspace.
- Start with Auto, or choose OAM, SAML, WNA, or OIDC to focus on one protocol.
- Select a transaction in Flow Navigator.
- Read its request sequence from top to bottom. Selecting an evidence request focuses the matching entry in Traffic Inspector.
- Review the assessment reason and confidence, then inspect every Pass, Review, or Fail validation check.
- Use Recommended Next Actions to identify the next configuration, browser, or server-log check.
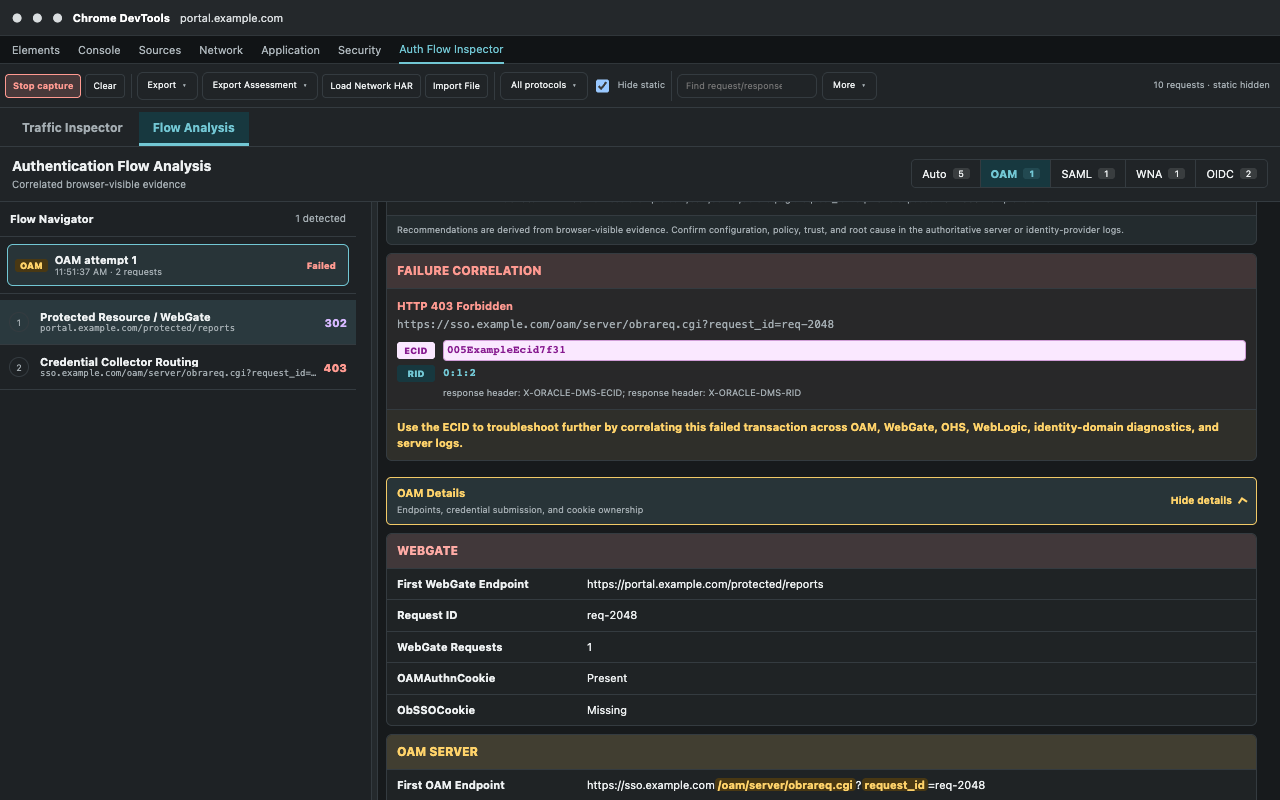
Flow Analysis evaluates related requests across the capture; the Traffic Inspector tabs remain precise to the currently selected request. Use both views together rather than treating either as a replacement for the other.
6. Know what evidence matters
| Flow | Browser-visible evidence to inspect | Typical failure clues |
|---|---|---|
| OAM / WebGate | Protected-resource redirect, obrareq.cgi/obrar.cgi, credential collection, request IDs, ECIDs, OAM and WebGate cookies, and application return. | Redirect loop, missing session cookie, OAM error response, failed credential submission, or no application return. |
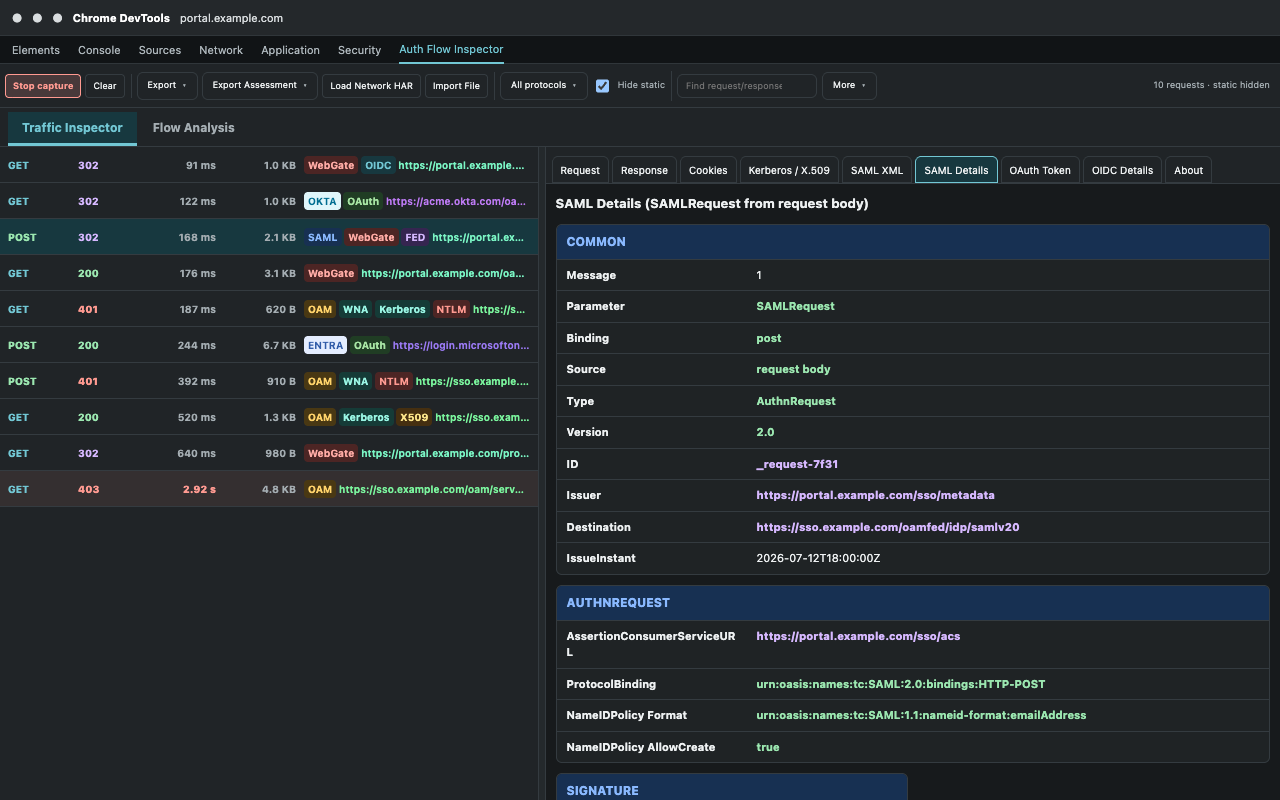
| SAML | SAMLRequest, SAMLResponse, RelayState, issuer, destination, InResponseTo, status, conditions, audience, signatures, and certificate dates. | Missing response, ID mismatch, non-success status, expired conditions, wrong destination/audience, or absent expected signature. |
| OAuth / OIDC | Authorization request, redirect URI, callback, state, nonce, PKCE, token evidence, issuer, audience, scopes, and token lifetime. | Missing callback, state/nonce mismatch, missing PKCE, provider error, wrong issuer/audience, or expired token. |
| Kerberos / WNA | Initial 401, WWW-Authenticate: Negotiate, browser Authorization response, WNA collector endpoint, and final authorization/session evidence. | Repeated 401, no browser token, NTLM fallback, token scheme mismatch, or no authenticated application return. |
| X.509 | X.509 collector endpoint, forwarded client-certificate headers, subject, issuer, serial number, validity dates, and final session evidence. | Certificate not forwarded, expired/not-yet-valid certificate, unexpected issuer/subject, or rejected credential collection. |
| Okta / Entra | Provider authority and endpoints, issuer metadata, provider error codes, request IDs, Entra trace/correlation IDs, and redirect context. | Provider error, tenant or authorization-server mismatch, policy denial, or callback failure. Preserve provider IDs for administrator logs. |
7. Export an assessment
- In Flow Analysis, select the transaction you want to report.
- Open Export Assessment.
- Choose Markdown Report - Sanitized for broader collaboration or support handoff.
- Choose Markdown Report - Full Diagnostic only for a restricted troubleshooting team that needs deployment and identity context.
- Review the exported report before sharing it and preserve the original HAR or full traffic export in a controlled location when deeper analysis may be required.
The report includes the selected flow outcome, validation evidence, request timeline, correlation keys, recommended next actions, relevant log locations, and known browser-capture limitations.
If the panel shows no useful data
- If Auth Flow Inspector is completely absent, confirm that the inspected tab is showing a normal
http://orhttps://page rather than New Tab or anotherchrome://page, then close and reopen DevTools. - Confirm that DevTools is attached to the tab performing the login.
- Open the panel before starting the authentication flow, then reload the protected page.
- Confirm that the button says Stop capture, which means capture is currently running.
- Select Reset filters and temporarily clear Hide static.
- Check whether the authentication flow opened a different tab or window.
- For offline evidence, open any ordinary website to host the DevTools panel, then use Import File for HAR/JSON. The hosting page does not need to be related to the imported capture.
- Use Load Network HAR only for entries currently exposed by Chrome's Network panel.